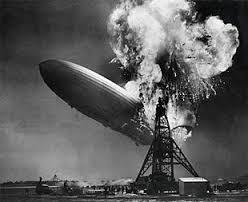
Questionable crash indicator 'Hindenburg Omen' was triggered this week
This indicator was on the money until people recognized it and then stopped working. Yet it has validity and may be due for big win. *JB*
• The "Hindenburg Omen" correctly called stock market crashes in 1987 and 2008, but has only been correct at predicting plunges about 30 percent of the time.
• The signal is still watched by traders and chart analysts for indicating signs of weakness ahead, but not necessarily a crash.
The "Hindenburg Omen," an obscure indicator that pops up every few years and gets Wall Street traders chattering about a possible market crash, was triggered this week. To be sure, the Hindenburg has missed the mark more times than it's been correct, but some analysts are concerned that the omen, when paired with other indicators flashing sell right now, could portend that at least a pullback is ahead this time.
Thursday's session saw the Hindenburg signal trigger a both the New York Stock Exchange and the Nasdaq, marking just the 10th time that's ever happened, according to Roberto Friedlander, head of energy trading at Seaport Global. There are three criteria for the Hindenburg signal to trigger, Friedlander said:
• First, the number of issues in a specific exchange hitting 52-week highs and lows must both exceed 2.2 percent of the number of issues in said exchange.
• Second, the McClellan oscillator — a measure of market breadth based on advancing and declining stocks — must be negative that day.
• Third, the benchmark index for the exchange must trade above its 50-day moving average.
On Thursday, the number of stocks hitting either 52-week highs and lows on both exchanges totaled more than 2.8 percent, Friedlander said. He added that the McClellan oscillator was negative for both the NYSE and the Nasdaq on Thursday. And the S&P 500 and the Nasdaq 100 are both above their 50-day moving averages, confirming the Hindenburg at the NYSE and Nasdaq, respectively.
"This is the first time since 2014 that a signal triggered on both exchanges on the same day – now that turns out to not be good for the market," Friedlander said in a note to clients Friday. "When Hindenburg signals flashed on both Nasdaq AND the NYSE (nine times prior to yesterday), mean return 1 month out was a loss of more than 5 percent and a year later [a] mean loss of almost 8 percent."
The indicator has successfully predicted a meaningful pullback less than 30 percent of the time, according to The Wall Street Journal. It did, however, foreshadow a market crash in 1987 and during the 2008 financial crisis.
But Chris Kimble, founder of Kimble Charting Solutions, said there are also signs of deterioration in other parts of the market.
"At the same time this took place this week, the all important banking index, could be completing the right shoulder at (4), of a head and shoulders topping pattern," he told CNBC via email. Banks have been some of the best performers since the November, as President Donald Trump's election brought hope to investors that key regulations — namely Dodd-Frank — would be scrapped or lessened.
Their deterioration coupled with the Hindenburg has Kimble worried.
Fred Imbert, CNBC

